HIGH GROWTH CHALLENGE: BUILDING A STRUCTURED SALES PROCESS
Of all the activities in the sales area this seems to be the most difficult for businesses to implement. I have to say I'm at a loss to understand why. Having consulted with organisations from very small to large, there appears to be a blind spot where building a structured sales pipeline is concerned.
WHAT IS A STRUCTURED PIPELINE & WHY IS IT IMPORTANT?
Let's go back a step and see what most commonly happens with pipeline reporting. For many businesses, particularly small companies; it's simply nonexistent which leaves them hopelessly exposed when business hits a downturn. They have no idea what shape they're in or, more importantly, be able to quantify what sales they need to get back on an even keel, how much activity needs to take place to generate the requisite sales, or the length of time it takes to get from first contact to order. This lack of knowledge is a major contributor to why many smaller businesses fail.
Very many companies have sales reporting and even have pipeline reporting but these are often completely ineffective. They tend to be unstructured and offer very little empirical evidence for the company management to use.
Consequently the pipeline is just as unstructured with a loose general format being used which allows the salespeople to view their pipeline using their own judgement rather than a standardised approach. Typically under these circumstances the quoted pipeline is huge and the amount of business closed is a very small percent (certainly less than 10%, frequently less than 5%) of the total. This is made worse because there is little or no correlation between the size of the pipeline and the sales closed thus making very difficult to predict future revenue streams.
WHAT SHOULD A STRUCTURED PIPELINE REPORT AIM TO ACHIEVE?
Firstly, it should enable you to view each sale in a consistent manner.
Second, it should clearly identify if a sales opportunity has progressed or stagnated.
Thirdly, it should contained a factoring index which will more accurately reflect the true value of the pipeline.
Fourthly, it should provide sales and/or company management with a consistent and reliable prediction of business that should be closed in the forthcoming period.
Fifth, it should be simple and relatively easy to complete (salespeople as a breed are poor at filling in reports).
Sixth, it should be focused on numbers rather than opinions.
To build a consistent view of each sales opportunity take the sales cycle in your business and break it down into discrete milestones.
So for example,
- Milestone 1 is a lead or an enquiry who has identified desire to purchase your product or service.
- Milestone 2 to progress the sale you need to demonstrate the product
- Milestone 3 they have the budget to pay for your product
- Milestone 4 you have submitted a proposal
- Milestone 5 you're on the shortlist
- Milestone 6 you have a verbal order
- Milestone 7 you have a written order.
The next step is to put percentages against these milestones for example,
1) 5%, 2) 10%, 3) 20%, 4) 25%, 5) 50%, 6) 90%, 7) 100%.
It should then end up looking like this.
If you want to download a copy of this spreadsheet please click on it
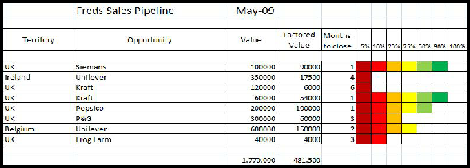
This approach allows you to build a factored pipeline i.e. the value of the opportunity time the percentage milestone. Don't get hung up about whether the percentages should be this or that number what we are building is something that will give you a consistent view across all your sales opportunities and not something which reflects the precise chance of winning per opportunity. The progress of the sale can be shown in any way you like; this could be as a table, a graph, or a set of traffic light colours going from red to green as you move along the sales process. Other information you need is simple; the prospect name, if it is a new or existing customer, the value of the opportunity and a projected win date.
By constructing what I have described you've gone a long way to getting a grip on your sales pipeline, you've now turned sales reporting into a set of numbers which over time you can analyse. For example you'll see which sales have stagnated because they won’t have moved along the pipeline for a period of time, you'll be able to identify how overoptimistic you sales force are by comparing the projected win date with the actual win date. Most commonly this is between 3-6 months.
Now that you have a factored pipeline you can start to build up metrics on the relationship between the size of your pipeline and your monthly sales. It also now enables you to look forward because as your factored pipeline rises and falls to will your sales, thus you can act early as soon as you see your pipeline numbers dip.
You should now at last start to get some sensible numbers to enable you to plan your business and you have moved from a jolly nice chat to a shorter focused and more effective sales meeting.


 For More Information Contact Us
